In the last blog post, we showed that linking your strategic moves together shows your team HOW you will generate more profit, greater cash flow, and ultimately achieve your mission.
This linking encapsulates your strategic hypothesis – “if we take these specific actions, we will generate this outcome”. It allows you to test your strategy and tell if it actually worked.
We used the balanced scorecard’s strategy map as a way to visualize the strategic moves.
Our hypothesis was, “if we add value to the customer, they will be more satisfied, and therefore will pay us more and stick around longer”. This should also allow us to sell more as our reputation improves in the market place.
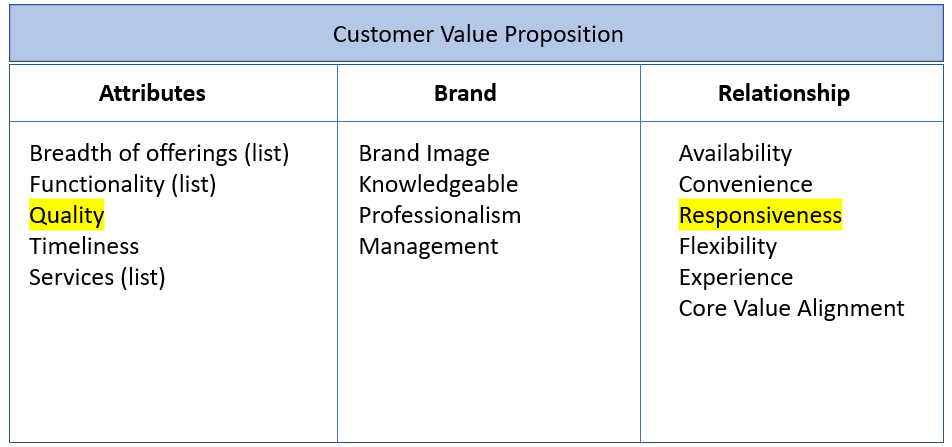
As a next step, we need to decide what activities add value to the customer. In a previous blog post, we used these categories to describe the types of activities that we think may add value. We also validated this with customer research.

Again, the balanced scorecard’s strategy map gives us a way to visualize this.
As an example, say we find through surveys and speaking with customers that “Quality” and “Responsiveness” are seen by the customer as driving real value.
We can make strategic moves in those two areas.
We also find that we are losing deals to competitors because of quality issues.
We can make another strategic hypothesis.
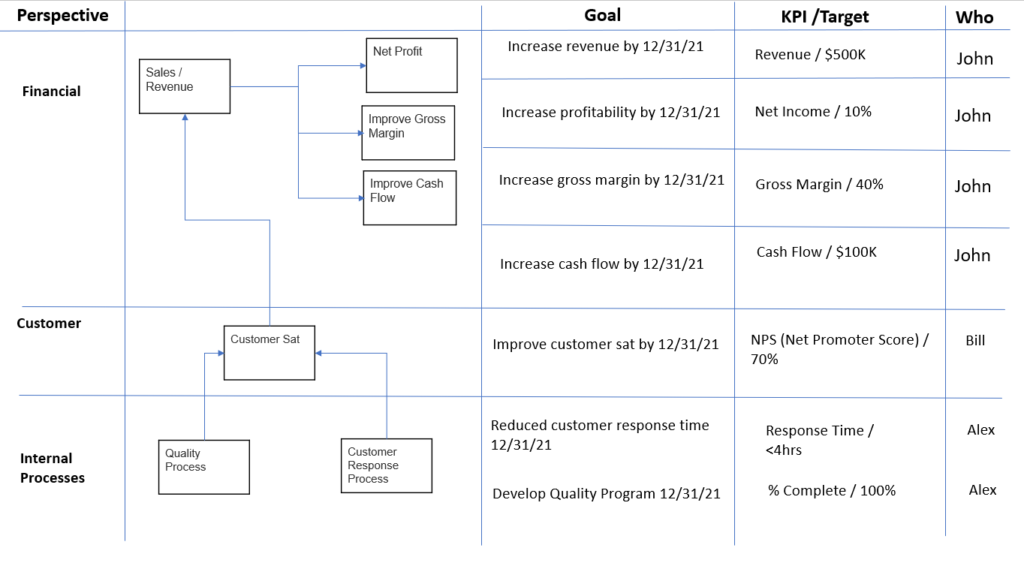
If we can improve our quality and customer response processes, that will drive improved customer satisfaction which will drive improved financial performance.
We can depict this using a strategy map with associated goals, KPIs, targets, and accountability.

Now we have mapped two critical internal processes to the improvement of customer satisfaction, which we believe will improve financial performance.
You may say, “John, we really don’t have the people or organizational capacity or culture to improve these processes.” We’ll address that in our next blog post.
As always, if you need help developing your strategy, contact us.